Ultimate Guide to Google Ads Metrics


Google Ads has a standard reporting dashboard with a few key metrics. Impressions, click-through rates, and average cost.
Some brands may already be overwhelmed with this data, not sure which metrics to value most or exactly what they mean.
It only becomes more complicated when you realize that there are dozens of different metrics that you can add to your reporting dashboard to interpret the true performance of your ad campaigns.
So what do the different metrics mean? And which are most important to pay close attention to?
In this guide to Google Ads metrics, we’re going to answer these questions, taking an in-depth look at each individual metric and discussing when you should pay attention to each.
Why All Metrics Aren’t Created Equal
All metrics are not created equal. They just aren’t.
Some metrics are going to be crucial, and you’ll want to have them front-and-center on your reporting dashboards so you can watch them closely. They’ll be strong indicators of the success and health of your campaigns.
Examples of these crucial-to-the-core metrics include interaction rates, conversion rates, and average cost per acquisition for your campaigns. These are major metrics that you need to be able to see quickly at a glance.
Other metrics are helpful, but really more in a big-picture sense.
Knowing your impression share, for example, isn’t going to help you determine whether or not your campaigns are a success, but it can help you get an idea of how often you’re ranking for different campaigns. Still, it’s not abnormal to have a lower impression share for high-value, high-competition keywords. This is a more holistic metric— good to watch, but not necessarily one to act on immediately.
The impressions metric is another useful one to consider, especially when compared to other key performance metrics (KPIs) such as conversions. It’s easy to place a lot of importance on the number of people who saw the ad, but this information is often most meaningful when analyzed in conjunction with other metrics.
This can be useful for big-picture ideas, and to troubleshoot potential issues. If you’re getting a lot of impressions but low click through rate and low click share that’s a good indication you need to adjust your ads to be more competitive.
It’s important to know which metrics are the most important and what they can tell you about your campaigns. That’s why we’ll be examining every metric you can add to your Google Ads dashboard. But first, we’ll show you how to access all of this data.
How to Add Additional Metrics to Your Google Ads Dashboard
Your Google Ads dashboard is going to be your holy grail when it comes to metrics and reporting. All the metrics we’re going to look at will be available through the reporting section here.
Some metrics must be manually added to your reporting dashboard or accessed through dedicated reports. This process is simple and only requires a few clicks.
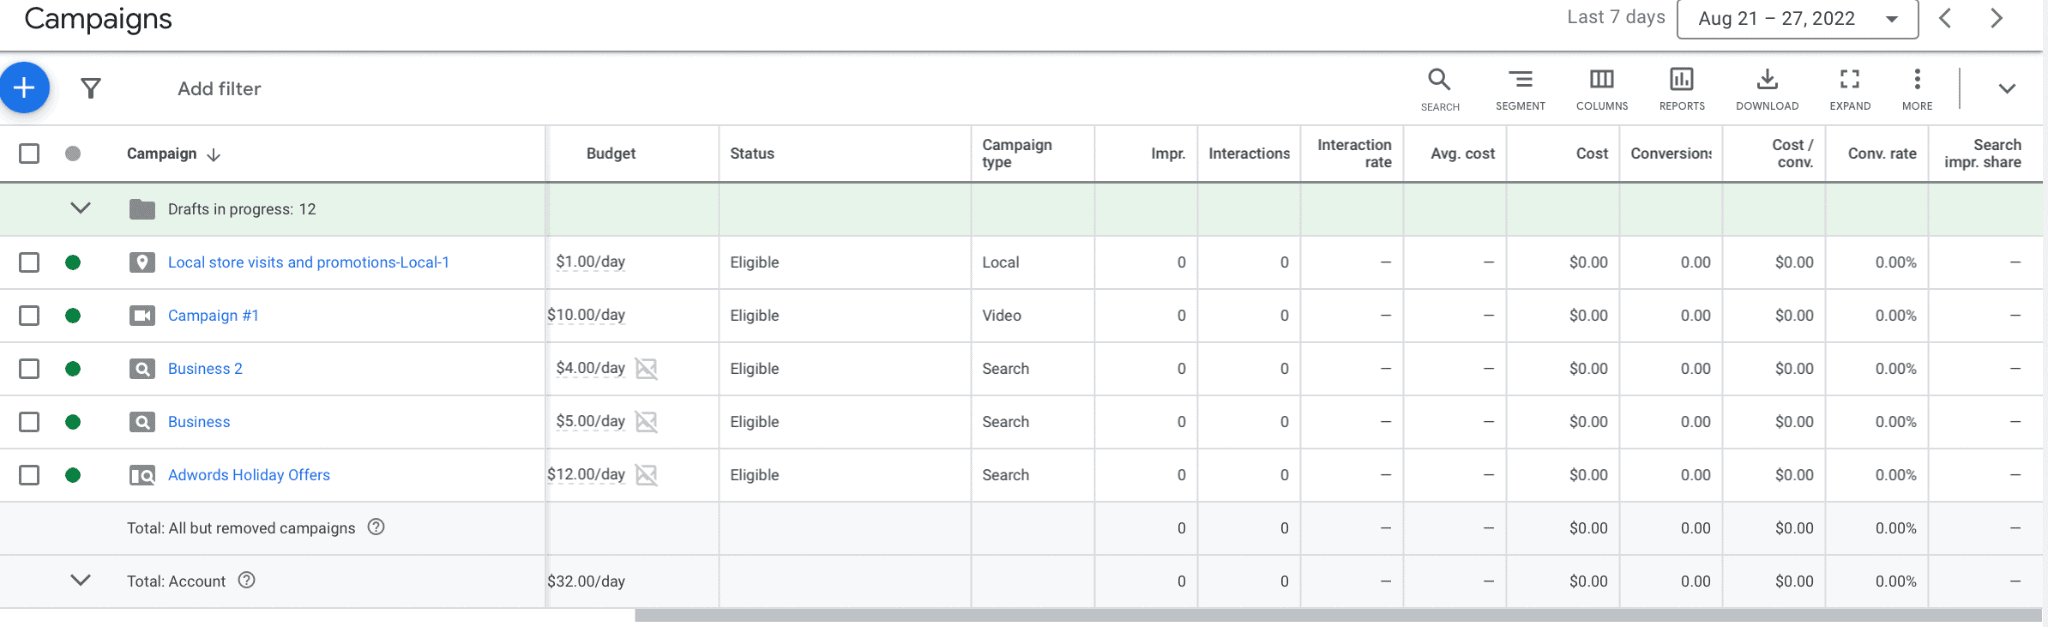
When you log into your ads manager account, it will look like this:
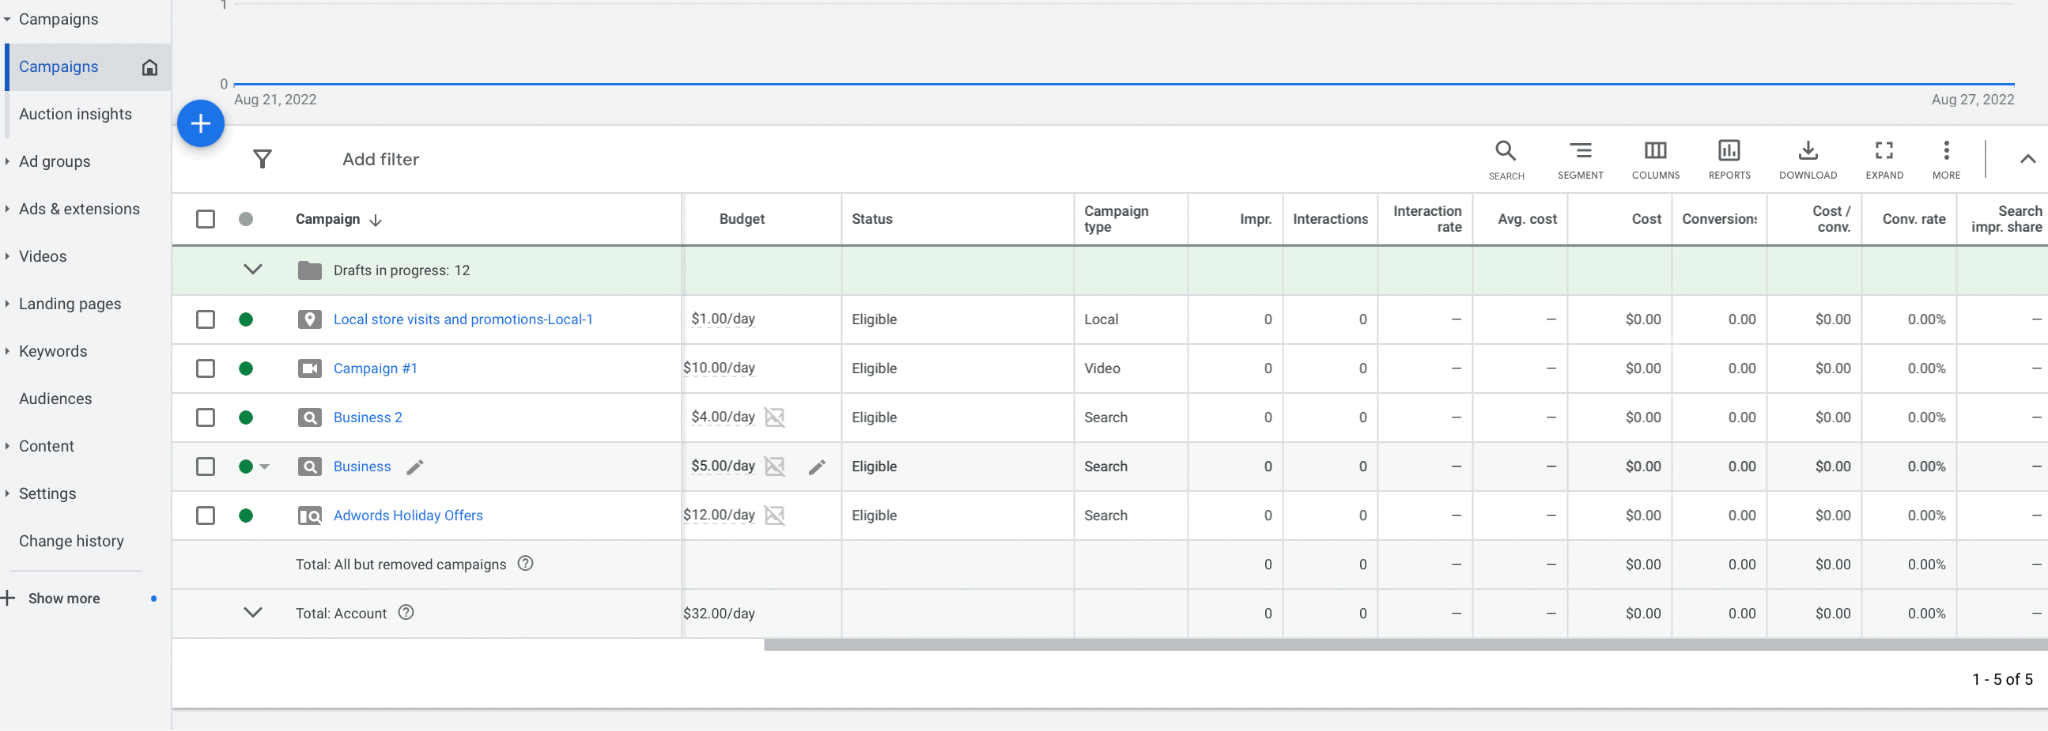
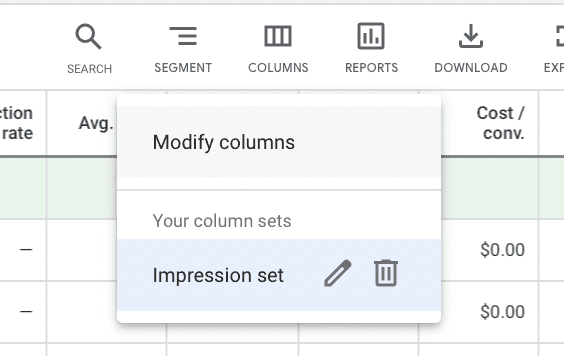
Core metrics such as cost, conversions, and interaction rates will be visible on your baseline dashboard. To add additional metrics to your dashboard, click on “Columns” in the top right corner of the navigation options, then select “Modify columns.”
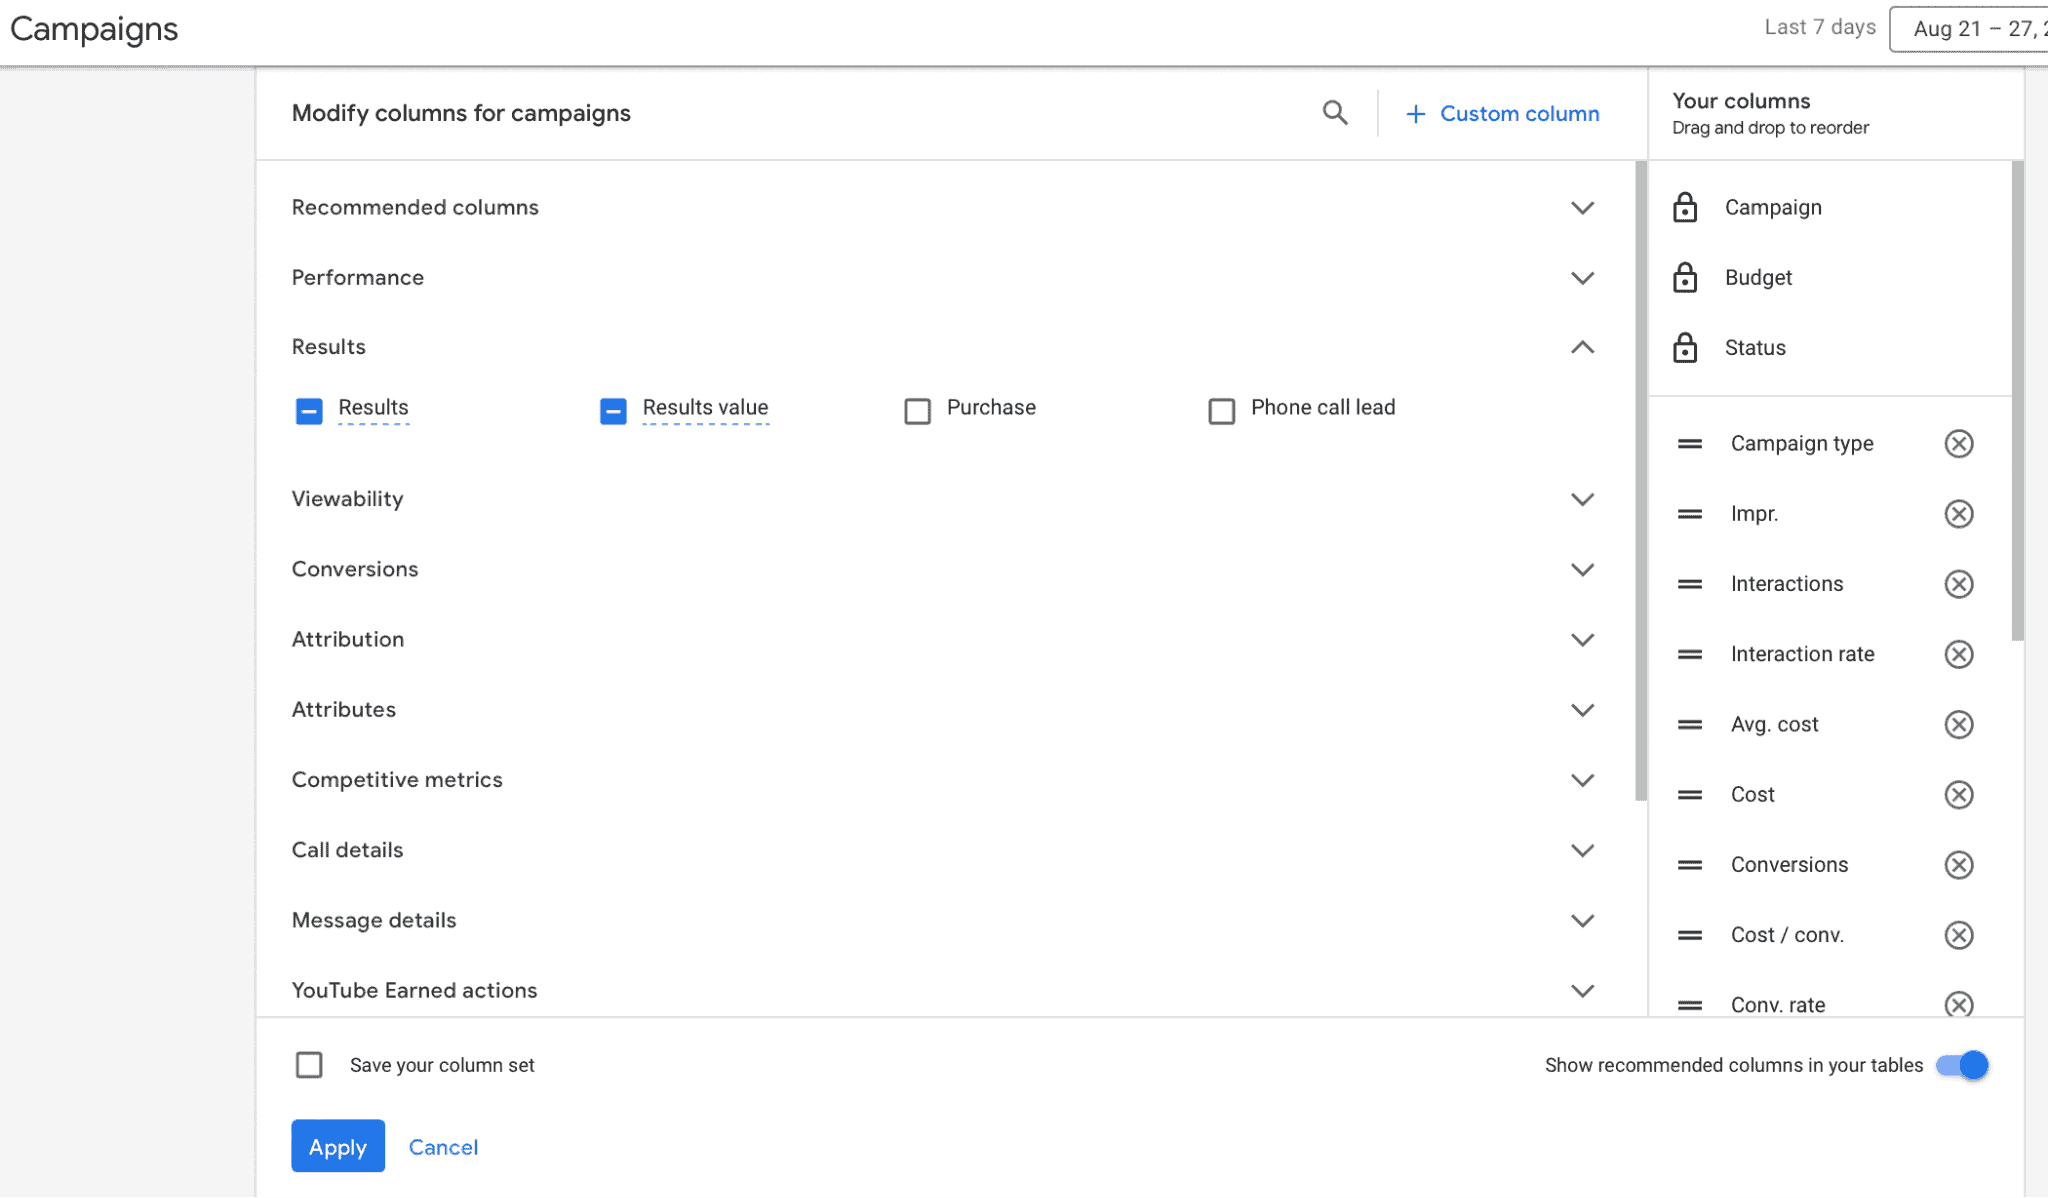
This will bring up a list of all the metrics available through Google Ads. To add the ones you want to your dashboard, simply check the boxes next to them and click “Apply” at the bottom of the screen.
It’s important to choose which metrics to track closely. We can help with that.
Your Core Google Ads Metrics
We’re going to start with the basics here.
What we’re going to call your “core” Google Ad metrics are those that are already set up on your dashboard by default. These are going to be significant metrics that can help give you the basic breakdown of your campaigns.
These are the metrics and what they mean:
Impressions
Impressions tell you how many times your ad is served. Think of this as the total number of times your ad was seen.
This does not tell you the number of unique users who saw the ad, just the total number of times the ad was served. One user may have seen the same ad several times.
This is useful to get an understanding of how far your ad is reaching and to ensure it’s being served.
Interactions
Interactions are the number of actions taken with your ad. In this case, it’s the main action taken for the specific ad type you’re running, like a click for text or Shopping ads and views for video ads. As such, they’re a vital metric to watch.
Interaction Rate
Your interaction rate is the ratio of interactions to impressions, found by dividing your total interactions to impressions. This gives you a quick at-a-glance metric to tell you how many people who see your ad are engaging with it.
Average Cost
This is a vital metric, telling you the average cost per interaction that you’ve paid. It will divide the total cost by your number of interactions. This is important to watch, because while some interactions will cost more and some will cost less, the average tells you a lot about how much you’re spending for clicks or views.
Cost
Cost details the total sum that you’ve paid for this particular campaign. This helps you track your overall ad spend.
Conversions
The conversions metric shows you the number of conversions you’ve received after initial ad interactions like clicks or views from all of the actions you’ve included here. Sometimes the interactions may be counted if you choose to include them, but other times you’re focusing exclusively on conversion types like appointments booked or purchases made.
Smart bidding optimizes for conversions.
Cost per conversion
The average cost you’re paying for each individual conversion. The total number of conversions are divided by cost. Since some users will interact with your ads but not convert, this gives you a better idea of how much you’re paying for individual conversions and not just potentially empty clicks as long as your conversions are tracking properly.
Search impression share
This metric tells you the impressions you’ve received on Google’s search sites divided by the total estimated number of impressions you were eligible to receive based on bids, quality, targeting settings, and approval statuses.
Simply put: Impression share determines how often your ad is showing up in placements you want and qualify for. Not every ad appears in every relevant, qualifying search.
Quality score
Your Quality Score takes a number of factors into account in order to give each individual campaign a score that assesses its potential relevance, quality, and success. It’s a complicated but vital score, as it can increase placements and rank and lower cost when it’s high, but decrease performance and increase cost when your ad rank is poor.
Learn more about your Google Ads Quality Score here.
Performance Metrics
Performance metrics are those that are going to prioritize direct actions on Google Ads. They are some of the most important to watch closely.
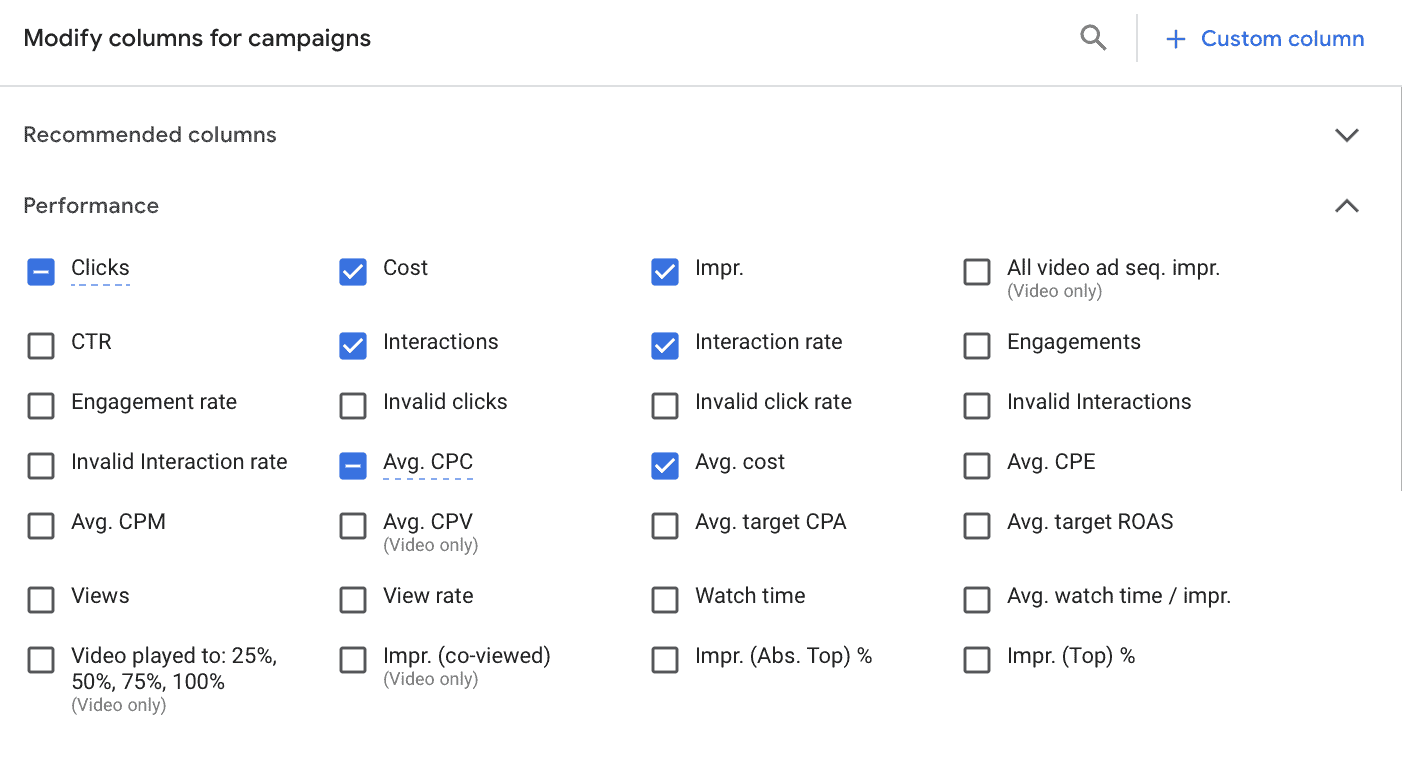
Clicks
The total number of clicks your ad has received. This metric helps you understand how relevant the ad was to the users who saw it and is an indicator of quality, relevance, and interest. Clicks are the most common primary interaction with an ad.
CTR
Click-through rate (CTR) tells you how many users saw your ad and clicked on it. It’s your total number of clicks divided by impressions. High click-through rate is a good indicator that your ad is highly relevant to the user’s search.
Engagements
This is any type of engagement with an ad, like viewing it for at least ten seconds or clicking on a video ad.
Engagement rate
The number of engagements per the total number of impressions, which is found by dividing total engagements by impressions. Interaction rate is most relevant, but this is another good metric to keep an eye on to see how relevant or engaging your ad is to users.
Invalid clicks
Invalid clicks are any clicks that Google considers to be illegitimate and may include repeated manual clicks or those generated by automated tools, bots, or fraudulent software. The advertiser is not charged for them, and they don’t impact any of your other statistics.
Invalid click rate
The percentage of clicks that have been removed from your total number of clicks due to being invalid. Again, the invalid clicks do not impact your campaign performance or your account standing in any way.
Invalid interactions
These are any interactions that Google considers to be illegitimate and doesn’t charge you for. Repeated manual views or clicks or those auto-generated are again often at fault here, and it can include invalid clicks but is not limited to them.
Average CPC
This tells you how your average cost-per-click (CPC), which determines how much you’re paying on average for each individual click. It’s important to remember that this is just an average, and some cost more than others, but this is a good baseline you can use to compare different campaigns with.
All video ad seq. impr.
The number of impressions from your video ad sequence campaigns, combined with the impressions from other campaigns that advanced the progress of sequence campaigns. This shows how campaigns outside of the sequence campaigns impacted them, and it requires users to have at least one impression from the video sequence.
It includes impressions from Display & Video 360 accounts.
Average CPM
Average CPM is your average cost per thousand impressions. This metric is not as vital as other interaction-specific performance metrics like CPA, CPA, or CPV.
Average CPV
Average cost-per-view (CPV) is a video-only metric that tells you the average amount you paid each time someone watches your video ad. It’s calculated by the total cost of all views divided by the total number of views..
Average CPA
This is your average cost-per-action (CPA) is the average target your bid strategy optimized for over a certain time period. It does include bid adjustments and ad group target CPAs.
Average target ROAS
Average target return on ad spend (ROAS) is the target that your bid strategy optimized for over a selected period of time. This is something that you can manually set.
Views & View rate
Views are counted when any of the following occur:
- Users watch 30 seconds of your video or more
- Users watch the full duration of the video if it’s under 30 seconds
- Users interact with your video
Eligible interactions will vary for different types of ad formats.
Your view rate is the number of counted views divided by impressions.
Watch time
The total amount of time that users spend watching your videos in sum. This metric alone isn’t as helpful as average watch time per impression.
Average watch time per impr.
Average watch time per impression measures how long the average user is watching your videos.
This tells you the average number of seconds individual users watched your video ad. This is a crucial quality-focused metric that tells you how much of your video ads the average user is watching. It can help you determine which videos are receiving the most watch time.
View played to: 25%, 50%, 75%, 100%
This is a video-only metric that assesses which percentage of viewers watched to specific points of the video. If “video played to 50%” has a 30% score, it means 30% of users watched half the video. This is another vital video metric.
Impr. (co-viewed)
Impressions (co-viewed) tells you the total number of people who saw your video ad. Unless you’re doing specific troubleshooting, this metric is typically not going to be essential. .
Impr. (Abs. Top)%
This is your Search Absolute Top Impression Rate metric, and it tells you the percent of your impressions that were shown as the very first ad above organic search results in Google. If this metric is high, it means that your campaigns are performing well; it may also mean that you’re overbidding.
Impr. (Top) %
Search top impression rate tells you the percentage of your impressions that are shown anywhere above the organic search results. This may include the top two to five ad results, depending on the search. This is a great metric to look at for changes in performance regarding your ad location.
Results Metrics
The results metrics section is brief, and it’s not nearly as important as the metrics in most others, because it provides more generic information than you can get in other categories.

Results
This shows your conversions broken down by conversion goal.
Results value
This is the conversion value generated by a campaign broken down by conversion goal. In most cases, your conversions-based metrics will be more useful.
Purchase
The number of users who made a purchase after clicking on your ad and within your attribution window.
Phone call lead
The number of leads that were generated through phone calls that came as a result of your ad campaign.
Viewability Metrics
Viewability metrics will help you to assess how much reach your ad campaigns are receiving. If you suspect that your campaigns aren’t getting the reach you think they should, these are some of the metrics you’ll want to turn to.
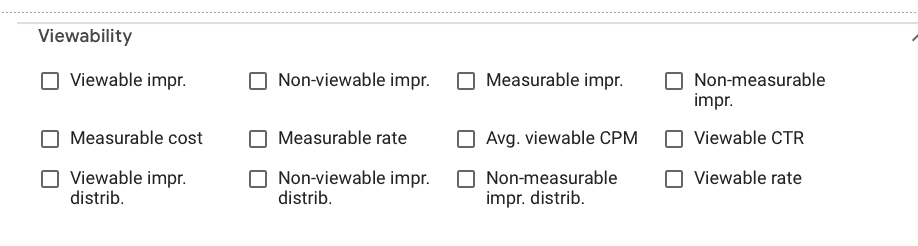
Viewable impressions
The number of times an ad was viewable, which is considered when at least 50% of the ad area is visible for one second for Display networks or two seconds for video ads.
Non-viewable impressions
The number of times your ad was considered non-viewable when published, which includes when it doesn’t have at least 50% of its area visible for at least one second on Display or two seconds for video ads.
Measurable impressions
The number of times your ad appeared in locations on websites or apps that could be measured for their viewability. This metric and the following typically isn’t crucial, because it doesn’t tell you much about performance.
Non-measurable impressions
The number of times your ad appeared in locations online that weren’t able to track and assess viewability. You may have still gotten views, but they weren’t able to be tracked.
Measurable cost
The total cost of all impressions that appeared in locations on sites or apps where viewability could be measured.
Measurable rate
The total percentage of impressions that appeared in locations on sites or apps that could measure for viewability, which includes both measurable and non-measurable impressions.
Average viewable CPM
The average amount you’ve been charged for 1,000 viewable impressions on Video and Display Network ads. If you’re running these campaigns, you may want to add this to your dashboard.
Viewable CTR
The frequency in which people click on your ad after it becomes viewable; this can help you assess if your ads are relevant enough to drive clicks.
Viewable impressions distribution
The percentage of your total ad impression share that were considered viewable. It’s found by dividing your total impression share by measurable impressions.
Non-viewable impressions distribution
The percentage of your total ad impressions that were considered non-viewable, including both measurable and non-measurable impressions. If you have a high number of non-viewable impressions, you may want to run tests to recalibrate your campaigns. .
Non-measurable impressions distribution
The percentage of total impressions that appeared in locations that aren’t able to measure viewability.
Viewable rate
The percentage of your measurable impressions that were viewable, which estimates how many impressions were actually seen by users. This is one of the more important metrics if you’re concerned about viewability and want an overall “health” check, because it gives you a good idea of what you’re working with quickly.
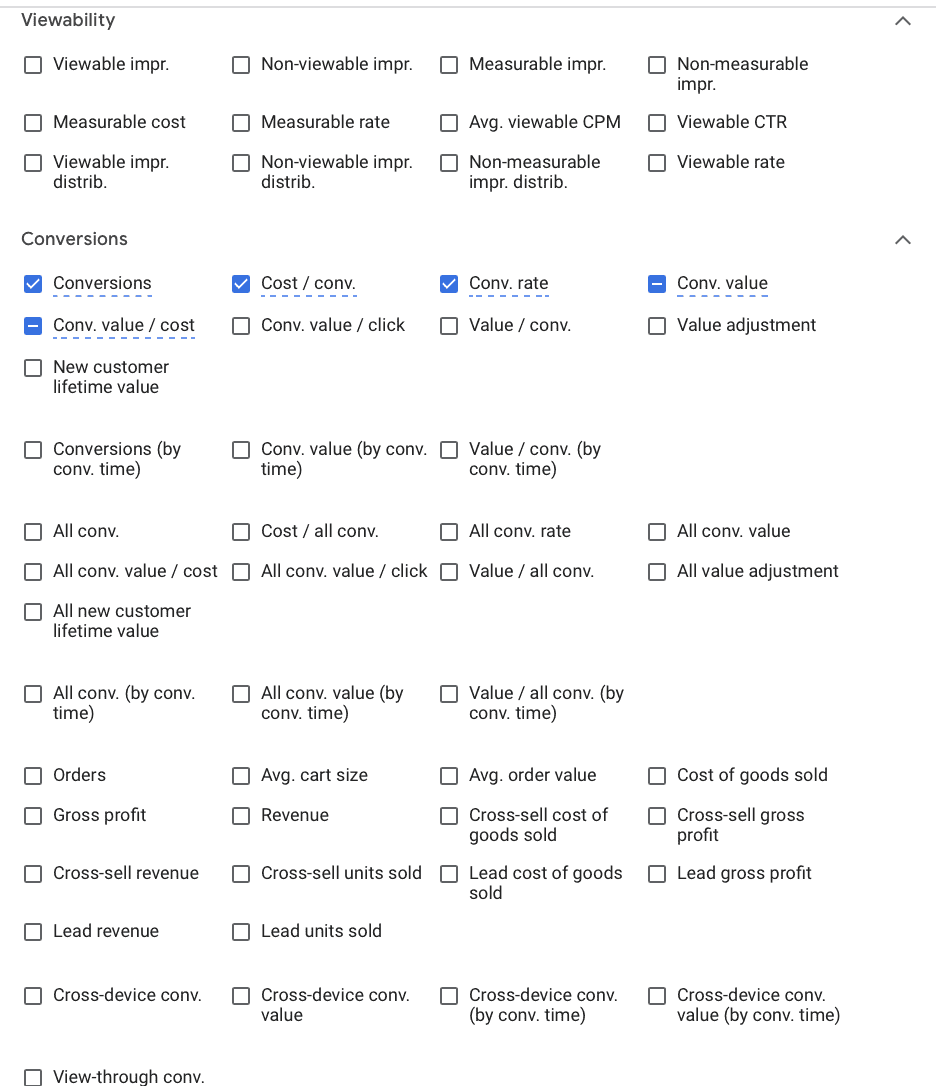
Conversion Metrics
Conversion metrics are those focused around real results and actions that happen after users see your ads. They’re some of the most important ones to focus on, because they help you to see the big picture and true effectiveness of your campaigns beyond on-platform actions, which is why some of them are already defined in the “core metrics” section. Most are self-explanatory.
Conversion value per click
The average conversion value of your ad interactions, found by dividing conversion value by the number of ad interactions. It does not include clicks that couldn’t lead to conversions, which can happen when you aren’t using conversion tracking.
Value per conversion
The average value per conversion, found by dividing conversion value by your total number of conversions. This is only an average; it does not help you assess how different factors may contribute to higher or lower average order values.
“By Conversion Time” Metrics
There are multiple different conversion metrics that you’ll see have a “by conversion time” included in them. We have an entire post on what these metrics are and how to utilize them here.
They include:
- Conversions by conversion time: Your conversion count based on the day a conversion occurred, based on the time the clicks occurred.
- Conversion value by conversion time: The conversion value based on the day each conversion occurred, based on the time the clicks occurred.
- All conversions by conversion time: All conversions count based on the day the conversions occurred, based on the time the clicks occurred.
- All conversion value by conversion time: Your total conversion value based on the day the conversion occurred, based on the time when the clicks occurred.
- Value/conversion by conversion time: Your value for each conversion based on the day the conversion occurred.
- Value/ all conversions by conversion time: The value for all conversions based on the day when the conversion occurred, based on the time clicks happened
Standard eCommerce Metrics
To keep things short and sweet, we’re going to compile a list of metrics that you already know from your own business (and likely track through your own eCommerce management system) that you can add to your dashboard in Google Ads if you so choose, especially since there can sometimes be a discrepancy between Google Ads and other data:
- Orders
- Average cart size
- Average order value
- Cost of goods sold
- Gross profit
- Revenue
- Cross-sell cost of goods sold
- Cross-sell gross profit
- Lead revenue
- Lead units sold
- Customer lifetime value (LTV)
Attribution Metrics
The attribution metrics section is an interesting one. You’ll notice that all of the metrics listed are those we’ve already defined, but with the phrase “(current model)” tacked on:
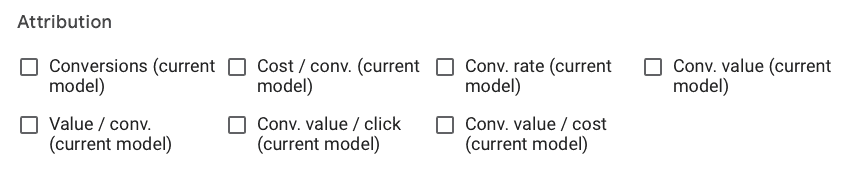
These metrics are all the same as defined above, but they’ll be shown with the currently-selected attribution model. Attribution models can change results based on how you choose to attribute credit to different touchpoints in your funnel, and your chosen lookback windows.
You can learn more about attribution models here.
Attributes
Your attributions section isn’t really a metric the way the others on this list are. Instead, they’re fields of information you can add as columns to help you make sense of your Google Ads campaign data.
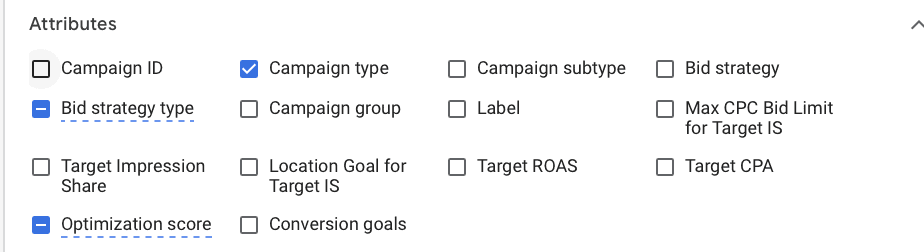
They’ll include information like your campaign type and subtype, your bid strategy, any labels, max CPC bid limits, target impression shares, target ROAS, target CPAs, and optimization scores.
The only thing that’s a metric here is your optimization score, which is an estimate from Google about how well your ads account will perform.
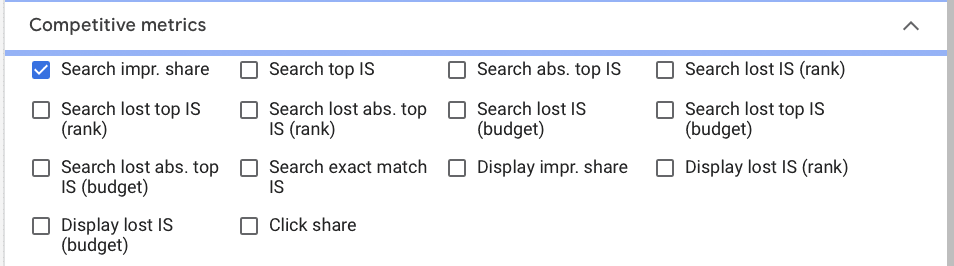
Competitive Metrics
This section of Google Ads data will help you get an idea of how your ads are performing in terms of visibility against your competition. It will give you insights into your impression share, but it’s important to note that this is only from Google Ads; data from search partners are not included.
Search top impression share
The impressions you’ve received in the top section of the search results page, above organic results, divided by the estimated number of impressions you were eligible to receive in this location.
This metric can be useful in helping you to determine if you need to improve your bid to rank for the top of page location, or if you need to tweak your keyword relevance. Learn more about how these factors impact Quality Score here.
Search absolute top impression share
The percentage of search ad impressions shown in the top, number one slot of the search page. It’s calculated by dividing absolute top impressions by total eligible top impressions.
Search lost impression share (rank)
This metric is an estimate of how often your ad didn’t show up on Google search sites due to a poor ad ranking. Keep an eye on this metric if you feel your ads are underperforming; it can be useful for troubleshooting.
Search lost top absolute impression share (rank)
An estimate of how often your ad wasn’t the very first ad above organic search results due to a low ad rank.
Search lost absolute top impressions share (budget)
Estimates how often your ad wasn’t the first ad above organic search results due to low budget; this is a red flag that you may need to consider upping your bid for high-value keywords if you can.
Search lost impression share (budget)
An estimate of how often your ad didn’t show up at all on Google search sites due to a low budget.
Search lost top impression share (budget)
An estimate of how often your ad didn’t show up above organic search results due to a low budget.
Search exact match impression share
This is the exact match impressions you’ve received, divided by the estimated number of exact match impressions you were eligible to receive.
Exact match impressions are those that either were an exact match of your keywords or were close variants.
Display impression share
The impressions you’ve received on the Google Display Network divided by the estimated number of impressions that you were eligible to receive.
Display lost impression share (rank)
The estimated percentage of impressions your ads didn’t receive on the Google Display Network due to poor Ad Rank. If this is the case, look into Google’s Better Ad Standards and see if that can help improve ad quality.
Display lost impression share (budget)
This estimates how often your ad didn’t show up in the Display Network when it otherwise could have due to low budget.
Click share
“Click share” is the clicks your ads have received on the Search Network divided by the estimated maximum number of clicks you could have otherwise received.
Call Details
Call details are centered around phone calls generated by Search Ads. These will help you track the number of calls you’ve received, and how often users saw your phone number.

Phone calls
The number of times users clicked on a phone number displayed in one of your ads on mobile, or manually dialed the Google forwarding number displayed in an ad on any device.
Phone impressions
The number of times your ad showed a Google forwarding number, or a Google forwarding number could have been shown to someone through your website as a result of an ad click.
PTR
Phone-through rate (PTR) is the total number of phone calls received divided by the number of phone impressions.
Message Details
Message details give you performance data around ads that are shown with the Message extension.

Chats
The number of people who have messaged your business using a Google forwarding number. If you’re optimizing for messages, this is a good one to watch.
Message impr.
The total number of times your message extension showed on your ad (which will be different from your impressions), and a Google forwarding number was used. This is required in order for the conversion to be tracked.
Chat rate
The number of users who initiated conversations with your business after seeing the message extension on your ad. Divide chats by the number of message impressions.
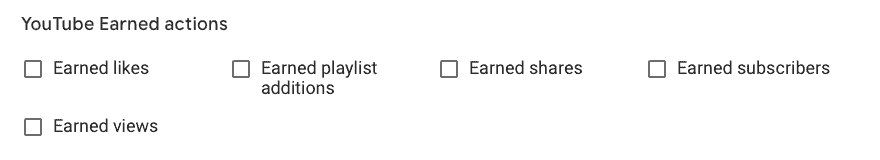
YouTube Earned Actions
YouTube’s Earned Actions section is exclusively for advertisers who are running YouTube Ads. They help you track actions that have happened as a result of your ad, even if they happen later. If you’re trying to grow your channel, this is an important section to watch, even though you aren’t charged for any of these actions.
Earned likes
This metric tracks when users view your video ad and then later lacks a video from your linked YouTube channel. This must occur within seven days of the initial view.
Earned playlist additions
When someone views your ad and then adds a video from your linked channel to a playlist within seven days of the initial view.
Earned shares
When someone views your ad and then shares a view from your linked channel within seven days of that initial view.
Earned subscribers
When someone subscribes to your linked YouTube channel within seven days after viewing your video ad.
Earned views
When users view your video ad and then watch another video on your linked YouTube channel within seven days of the initial view.
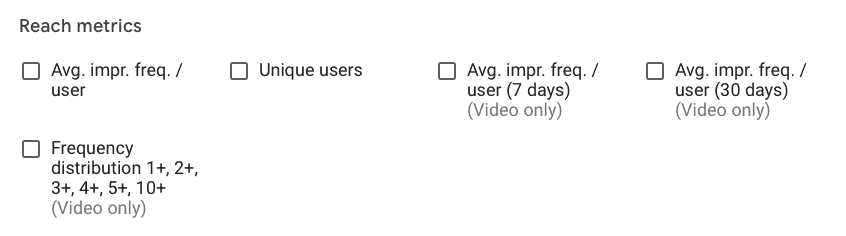
Reach Metrics
Reach metrics can help you see not just the total number of impressions your ad got, but to get a better idea of how many individual users saw your ad. These metrics can be incredibly useful to help you determine if you need to expand or shake up targeting, or adjust other ad settings.
Average impression frequency per user
This is the number of times a single individual user saw your ad within a specific time frame. It’s important to remember that users who have seen your ad once or twice might convert the third time viewing the same ad, but they’re unlikely to do so after the tenth view.
Unique users
The number of unique individual users who saw an ad in Display or video campaigns over a given period. This can be much more helpful at gauging your true reach compared to impressions.
Average impression frequency per user (7 days)
This is how often individual users will see an ad from your campaign on average within a 7-day period.
Average impression frequency per user (30 days)
This is how often individual users will see an ad from your campaign on average within a 30-day period. It’s typically better for this metric to be higher than its 7-day counterpart.
Frequency distribution 1+, 2+. 3+, 4+, 5+, 10+
How many people saw your ads a certain number of times over a given time period; it can only show data for a date range of 31 days or less.
Final Thoughts
There you have it: The full current list of Google Ads metrics and what they mean, and how to use them to access the health and status of your campaigns. There’s a lot to sort through, and knowing which metrics to focus on throughout your campaigns— and which you can use to troubleshoot potential issues— can be imperative. This guide is a good start, and we can help with the rest if you need it!
Still overwhelmed with Google Ads data and how to leverage it to optimize your campaigns? We’re here to help you make sense of your existing ad campaigns, with suggestions for optimization based on existing data and the ability to help you create stronger campaigns than ever before. Get in touch with us here.
